Case Study 02
Untangling a regulatory maze for 8,000 industrial facilities, redesigning a fragmented emissions reporting platform into a high-efficiency compliance engine.
Confidentiality note: Certain details have been generalized to protect client identity. AI-generated imagery and blurred visuals are used throughout to protect proprietary designs. The research methodology, outcomes, and design decisions reflect real project work.
Overview
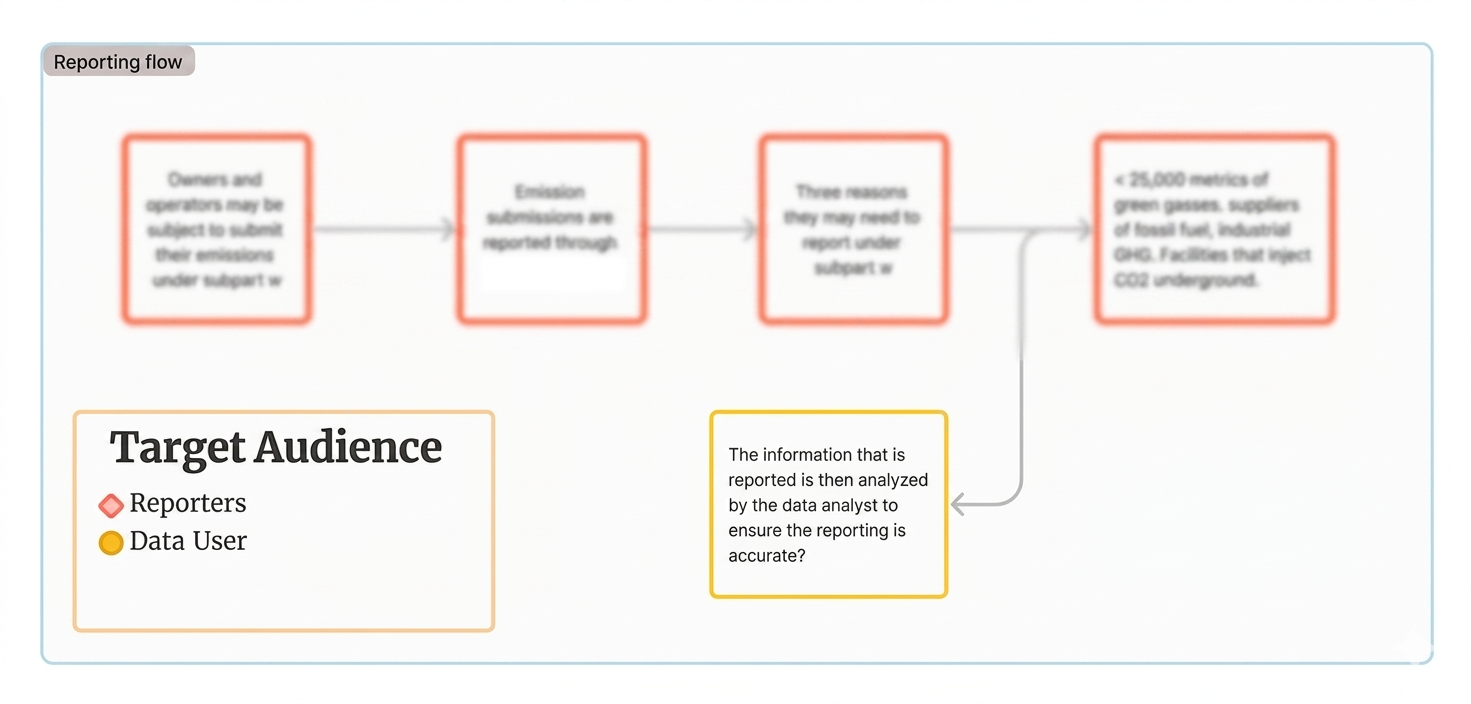
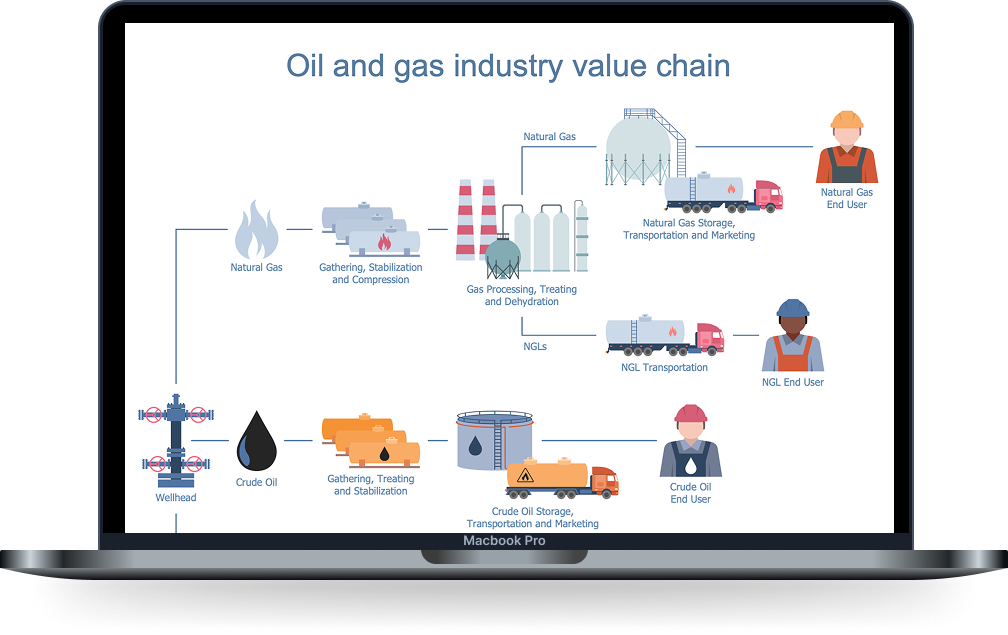
The National Environmental Data Program collects emissions data from 8,000 industrial facilities, while its Financial Mitigation Branch uses this data to administer regulatory charges and fund mitigation efforts.
Users could not distinguish between the long-standing Primary Reporting Program and the newer Financial Mitigation Program. This "content confusion" led to misinterpretations of reporting requirements, disorganized navigation for technical data subsets, and increased risks of costly regulatory errors.
"Industry professionals were spending excessive time searching for rulemaking templates, leading to reporting delays, compliance risk, and significant frustration." - Melissa M
Key Metrics
Research & Discovery
The project aimed to clarify the relationship between the financial and reporting branches, improve content findability, and establish a scalable information architecture to support future regulatory updates, all while reducing reporting errors for 8,000 facilities.
Users needed to see how technical reporting data directly informed financial charges, but the two sections existed as isolated silos with no contextual pathway between them.
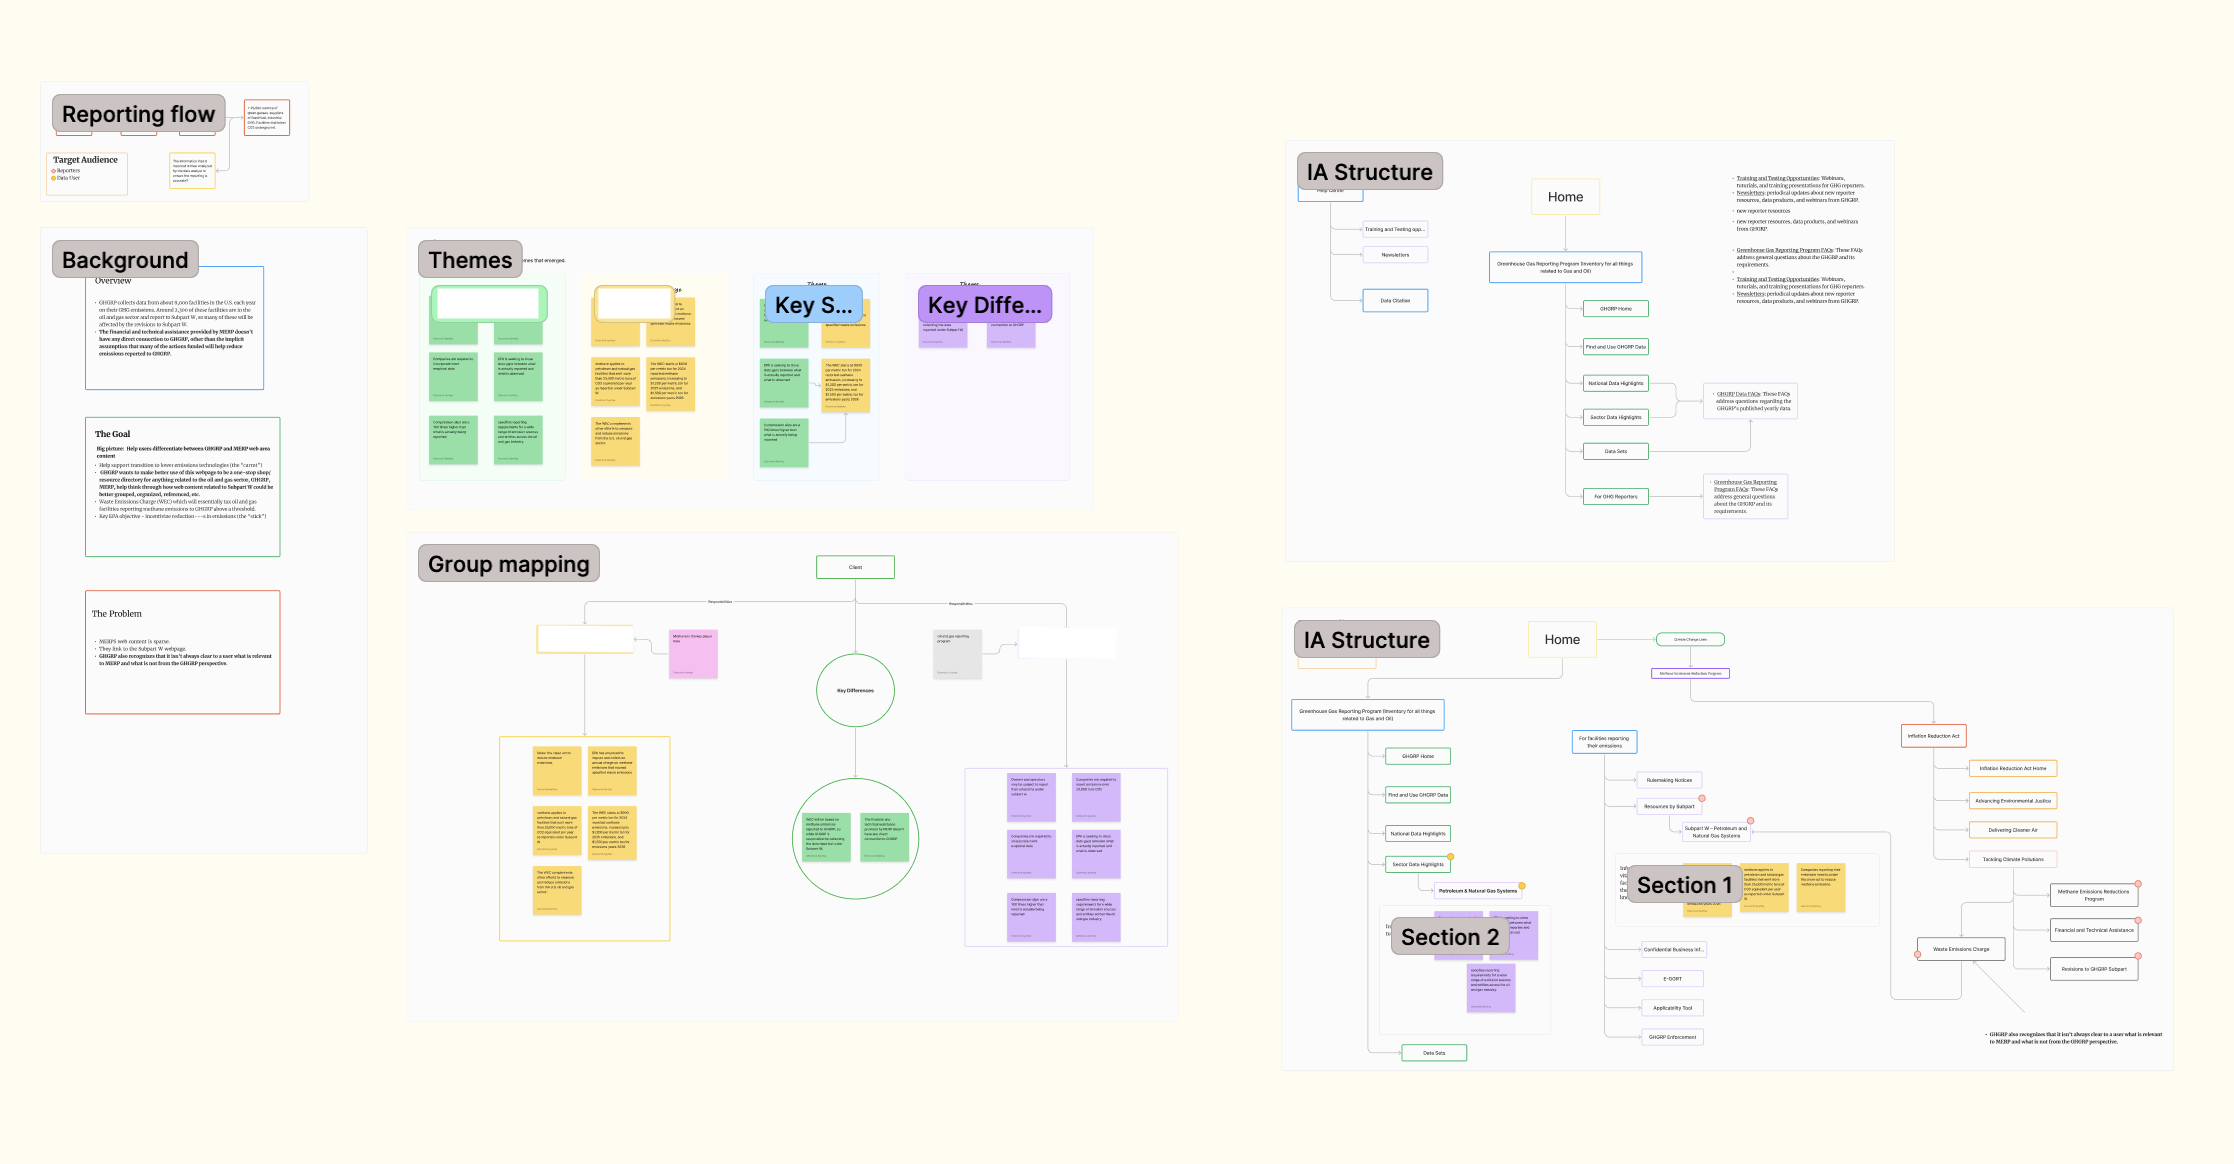
The existing IA had no clear parent/child hierarchy. Technical data subsets were scattered across both programs, making it impossible to build a mental model of the site.
Misinterpretations weren't just UX failures; they carried real compliance risk for facilities. Errors in this system have direct regulatory and financial consequences.
Process
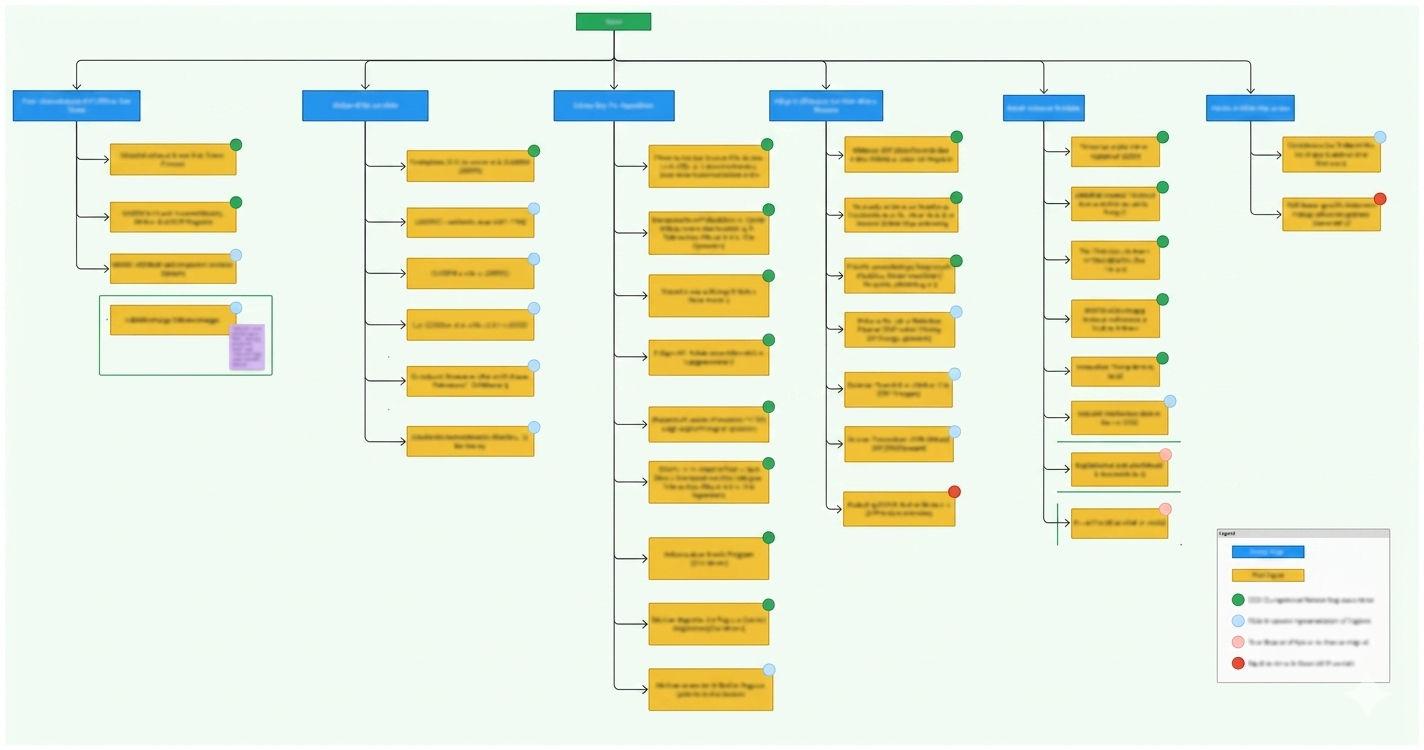
Conducted card sorting with 24 participants, generating a popularity matrix that revealed how users mentally grouped content, surfacing the exact pages causing the most confusion.
Built a data-driven site map with clear parent/child hierarchies and strategic cross-links. The matrix gave us the quantitative evidence needed to move contested pages without internal debate.
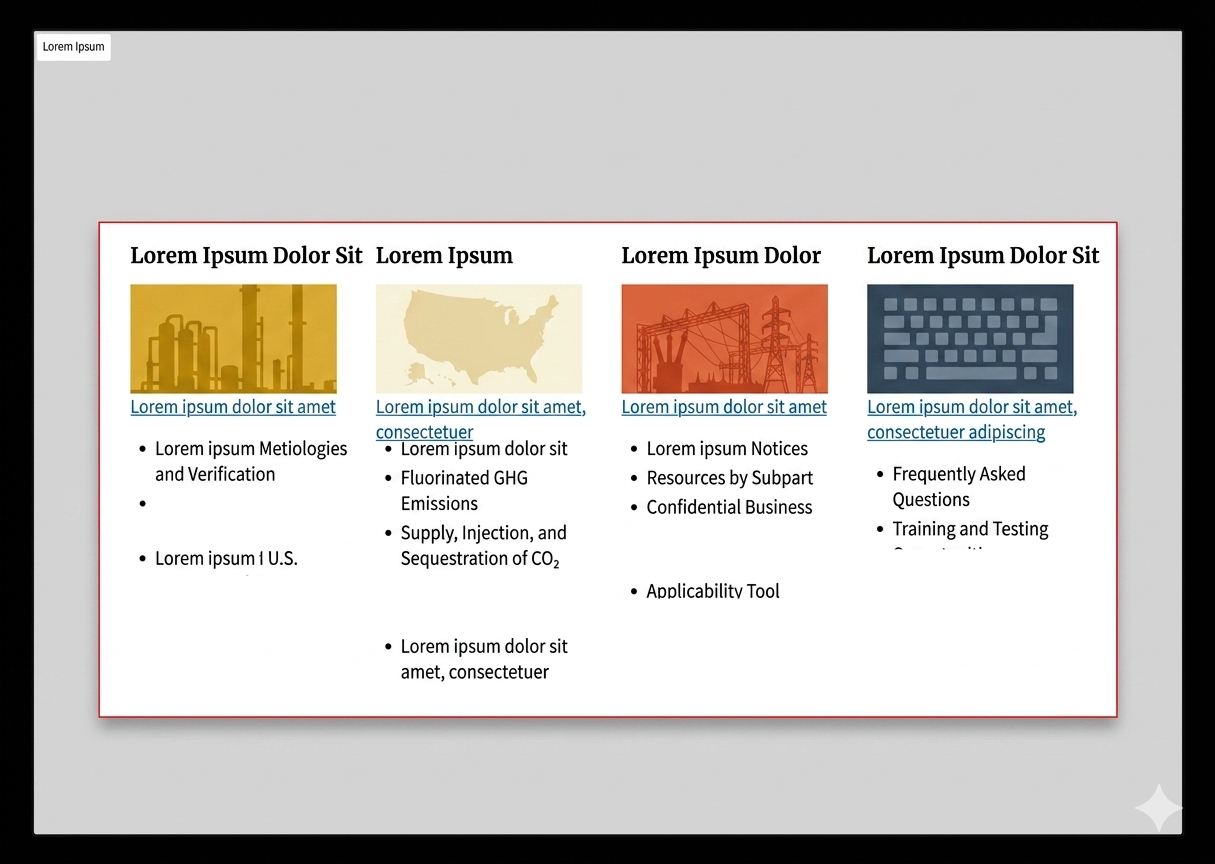
Translated the validated IA into testable wireframes, iterating on navigation flows and the cross-link structure connecting the reporting and financial sections.
Used Optimal Workshop tree testing to validate task completion efficiency, catching pathway errors before any high-fidelity work began, saving time and stakeholder capital.
Facilitated collaborative sessions with stakeholders, developers, and environmental specialists to align on technical feasibility, business priorities, and compliance constraints.
Final Solution
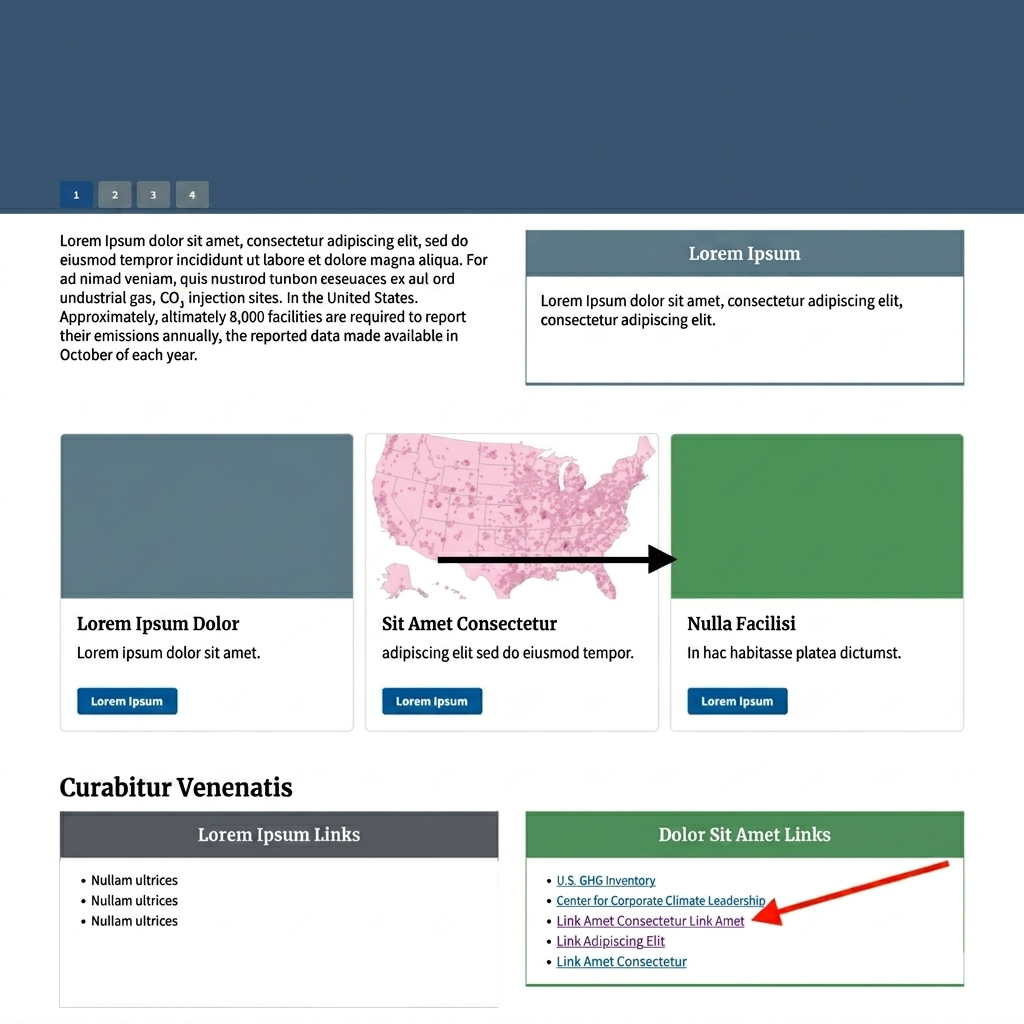
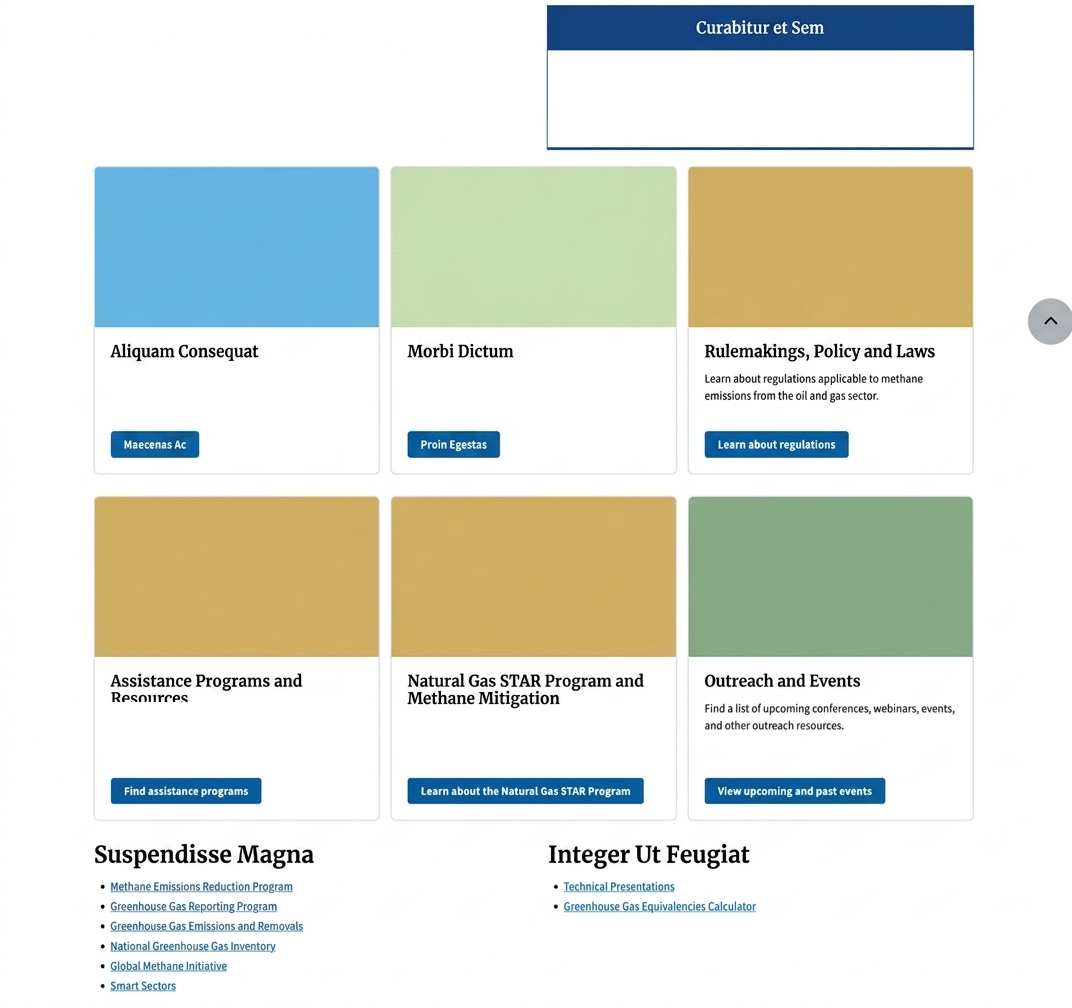
The final architecture introduced a dedicated Financial Mitigation section nested strategically within the broader reporting web area, with a cross-link connecting it back to primary reporting at exactly the moment users need to transition between them.
Reflection
Cross-linking two programs with different legislative origins but overlapping data. The technical constraint meant the IA had to be precise: a wrong cross-link could increase confusion rather than reduce it.
The popularity matrix was the single most persuasive artifact in the project. Quantitative data from card sorting settled internal stakeholder debates about content placement that subjective opinions never could.
Implement first-click testing even earlier in the wireframing phase to catch "pathway errors" before the site map is finalized, preventing downstream rework in the high-fidelity stage.